|
|
|
|
|
|
|
|
|
The curves shall fully cover the range of variables specified in ATC 105 as follows;
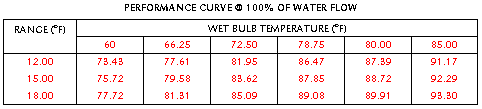
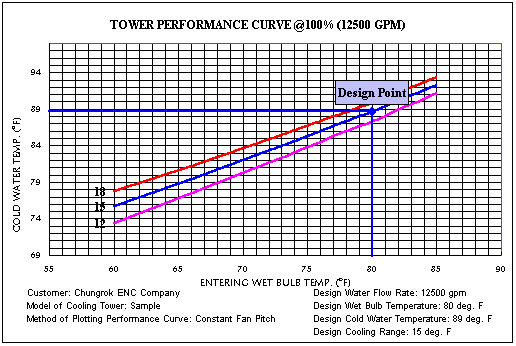
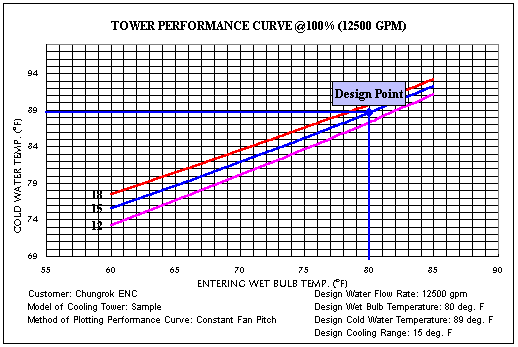
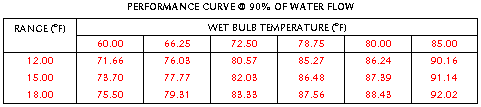
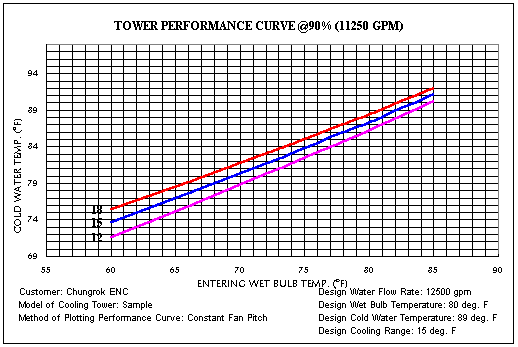
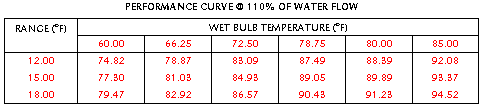
The performance curves could be prepared by the simple method and detail method, which shall be discussed later. The performance (= cold water temperature) prediction of cooling tower by means of the simple method is made by a few design parameters as well as water flow rate, L/G, KaV/L, range, cold water temp., wet bulb tem., and fan bhp, while the performance prediction by the detail method is requiring all the actual cooling tower dimensions, thermal rating conditions, and all the mechanical rating conditions. Example 17-1: Plot the performance curve by the method of constant fan pitch and simple method using the example 16-1. (Solution) 1) Performance Curve @100% of Design Water Flow Rate
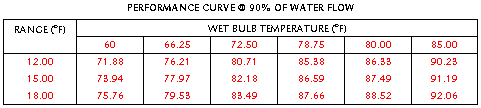
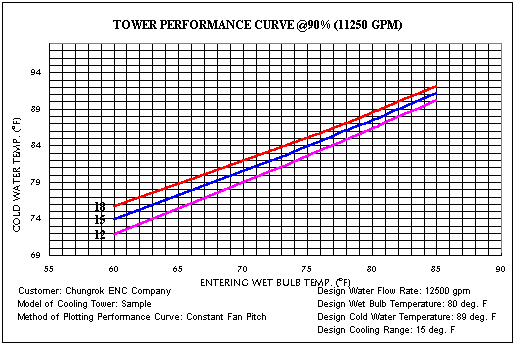
2) Performance Curve @90% of Design Water Flow Rate
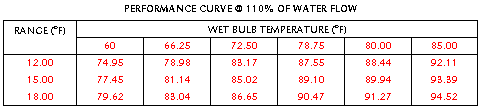
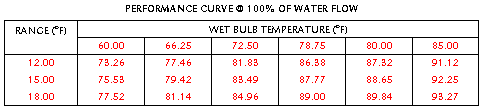
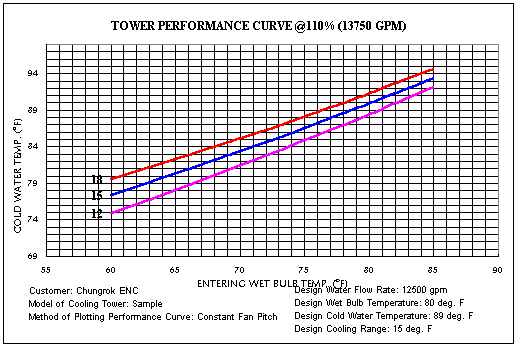
3) Performance Curve @110% of Design Water Flow Rate
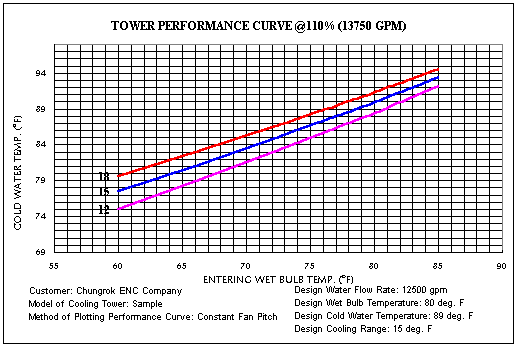
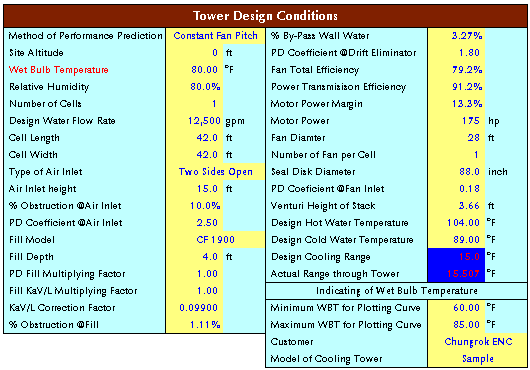
The file used here is same as one used for example 16-1. Example 17-2. Plot a set of performance curves presenting the cold water temperature vs wet bulb temperature by the constant fan pitch and the detail method using the same example 16-1. (Solution)
The curves are plotted for 80, 100 & 120% of cooling range on 90, 100 & 110% of design water flow rate. Note that these performance curves are based on the constant fan pitch and are plotted by the detail method. For further details of calculation, download the file.
Please compare these results
of cold water temperature obtained by detail method
and simple method. You will see that the difference
between these two results is very minor. So, the simple
method is strongly recommended to use in practice. |