1) Conception of Noise

The sound created in the air is caused by the diaphragm moving back and forth in the air which sets the air particles to vibrating, producing a variation in normal atmospheric pressure. As these pressure variations spread they may come into contact with our ear drums causing them to vibrate. The vibrations of our ear drums are then translated by our complicated hearing mechanisms into the sensations we call "SOUND". It should be noted here that sound is defined in two ways; first as a physical disturbance - in this case in the air, and secondly as a sensation in the ear of the listener.

Normally when we hear the sound of an orchestra, we refer to it as music, something pleasing to the ear. But, if we were to hear an orchestra during the middle of our normal sleeping period this would then be noise to us. Noise is defined as unwanted sound. Sound, in turn, can be described as repeated pressure fluctuations characterized by its amplitude or sound pressure, its frequency in time, and its spatial variation or wave length. The velocity of sound in air is approximately 1,130 ft per second at standard temperature and pressure. Velocity, frequency, and wave length can be expressed by the equation: frequency x wavelength = velocity.

Sound propagates in air as a longitudinal wave, that is a wave where the motion of small regions of the medium is parallel to the direction of propagation. These pressure variations will occur at a given position with the frequency (f), equal to the frequency of the source disturbance. The distance between pressure peaks at any instant in time will be the velocity divided by the frequency;

Wavelength = c / f = 1130 / 1000 = 1.13 ft.

Octave Band Center Frequencies (Hz)

Band Edge Frequencies (Nominal Bandwidths)

31.5

22.3 - 44.6

63

44.6 - 88.5

125

88.5 - 177

250

177 - 354

500

354 - 707

1,000

707 - 1,414

2,000

1,414 - 2,830

4,000

2,830 - 5,650

8,000

5,650 - 11,300

16,000

11,300 - 22,600

Since our hearing mechanism can only hear frequencies in the range of 20 Hz (CPS) to 20 KHz this is all that most sound level meters attempt to measure. Only those persons with very keen hearing are able to hear 20 Hz to 20,000 Hz. For this reason most codes are established to measure the sound energy between 45 Hz and 11.3 Khz inclusive. But the initial range mention has been divided into sub-divisions called octave bands, as given in below table, with the width of the band having a ratio for the lower frequency to the higher frequency of 2:1. These standard octave bands are named by their center frequencies. The purpose for dividing the frequency range up in this manner is because the ear seems to sense frequency on such a logarithmic scale.

When more detailed analysis of the distribution of sound energy as a function of frequency is required the bands are normally divided into one-third octave bands. This form of analysis gives a better indication as to which frequencies are most troublesome and is very useful when noise levels are excessive and need to be lowered.

The term of decibel has been borrowed from the electrical communications engineering group, and is a dimensionless quantity. By definition, it is 10 times the logarithm (to the base 10) of a quantity (in dimensional units), to some reference quantity (in the same dimensional units); with these units being proportional to power. It is most convenient to use this logarithmic scale because the range of acoustic powers that are of interest in noise measurement are approximately one quintillion to one (1018: 1). For example, the sound power of a soft whisper is about 0.000000001 watts (10-9), whereas, the sound power of a ram jet is about 100,000 watts. This wound be extremely difficult to plot on a linear scale but when plotted against decibels of sound power (with reference to 10-12 watts) these equal 30 and 170 decibels.

As indicated in the previous paragraph, sound power is normally expressed as a power level with respect to a reference power. Power level (PWL) is defined as; PWL = 10 Log (W / 10-12) re 10-12 watts, where W is the acoustic power in watts and re means referred to. It sound be noted here that no instrument for directly measuring the power level of a source is available. Sound power is a measure of the intensity of a sound (watt/m2) at its source and cannot be measured directly at some distant point.

From the elementary physics that the intensity I of a wave is defined as the time average rate which energy is transported by the wave per unit area across a surface perpendicular to the direction of propagation. More briefly, the intensity is the average power transported per unit area. Here we would note that the power developed by a force equals the product of force times velocity. Hence, the power per unit area in a sound wave equals the product of the excess pressure (force per unit area) times the particle velocity. Averaging over one cycle, it can be proved that I = rcv2 = P2/rc. Where P (= rcv) is the pressure amplitude, r is the average density of air, and c is the velocity of the sound wave. It will be noted that the intensity (power) is proportional to the square of the pressure amplitude, a result which is true for any sort of wave motion.

Obviously what we measure with the sound-level meters are these pressure fluctuations which we read as decibels of sound pressure levels. The definition of sound pressure level (SPL) is 20 Log (P in mirobars/0.0002 microbars) or 10 Log (I/10-12), where P is the root mean-square sound pressure (RMS) of sound in question. The unit used to measure pressure here is the microbar which is approximately one-millionth of the normal atmospheric pressure (standard atmospheric pressure = 1,013,250 microbars). The reference sound pressure was obtained from the relation of P0 = (rcI0)1/2 = (400 x 10 -12) 1/2 = 2 x 10 -5 (Pascal). (rc is called Specific Acoustic Resistance and its value is about 400(SI).)

If we can measure only sound pressure at some distant point from a source, how do we determine the sound power of the source in question? Let us investigate the manner in which the sound intensity radiates from a simple source. Assume for a moment that we have a small spherical sound source, such as a balloon, that radiates energy uniformly over its entire surface. Also, let this sphere be located far enough away from the ground and all other obstructions (free field) so that it will radiate energy uniformly in all directions. If the total energy is I0 at the sphere then the total energy at some given radius from the source will be spread over an area equal to the area of the sphere at this radius. This area is equal to 4 pr2. As we proceed radially outward from this sphere we notice that energy per unit area varies as the ratio of the square of the radii and, as we have already shown, this energy also varies as the square of the pressure. From this information we are able to write an expression for sound power level (PWL) as

I = W / (Surface of Sphere = 4 pr2) for free field, or W = 4 pr2I, where r is a distance from a source in meter.
SPL = 10 Log (I/10-12)
PWL = 10 Log (W/10-12)
= 10 Log (4 pr2I/10-12)
= 10 Log (I/10-12) + 10 Log (4 pr2)
= SPL + 10 Log r2 + 10 Log (4p)
= SPL + 10 Log r2 + 10.99 (or SPL + 10 Log r2 + 0.67, r in foot)

I = W / (Surface of Half Sphere = 2pr2) for half free field (= smooth ground level)
PWL = 10 Log (2pr2I/10-12)
= SPL + 10 Log r2 + 7.98 (or SPL + 10 Log r2 - 0.23)

From above equations, we can see that SPL at half free field is higher than SPL at free field by 3.01 dB(A). Most generally the sound source is setting on the ground with obstacles around it. These obstructions will either reflect or absorb this sound.

Consider, for instance, a source that is setting on a flat reflective surface so that all the sound energy is being spread over a hemisphere. Obviously there is twice as much energy per unit area of any given hemisphere as there would be for a similar sphere of the same radius; assuming that we have the same uniform source. If we wished to calculate the free field sound power level of the source we would have to correct for this directivity factor. Here we should define exactly what is meant by directivity factor. It is the ratio of the mean-square pressure (or intensity) on a specified axis of a transducer and at a stated distance to the mean-square pressure (or intensity) with reference to the mean-square pressure that would be produced at the same position by a spherical source if it were radiating the same total acoustical power. A free field is assumed as the environment for the measurement. The point of observation must be sufficiently remote from the transducer for spherical divergence to exist.

What does this mean? Here we are saying that our previously defined equations are good for a uniform sound source. Actually, there are few, if any, uniform sound sources. Most will radiate sound energy more directly in one direction than in others. The directivity factor is the ratio of the mean-square pressure at some point with reference to what a uniform source would radiate in that direction in free space. This says that a source may have a directivity factor of more than 1.0 in some directions and less in others. It also says that anytime sound is reflected, you change the direcivity factor.

Let us take an example of what this means in actual practice. Suppose a customer buys some unit that is rated at 85 dB (SPL) in free field tests at some specified distance. He installs this unit in his place of business against a concrete wall and takes a reading at the specified distance with a calibrated sound-level meter. He determines the SPL to be 90 dB, and assumes the manufacturers did not correctly state the SPL at this distance. In actually, the manufacturers stated free field test results were probably accurate, but the customer did not properly consider such things as the room characteristics (reverberation, absorption, etc.) and the fact that the unit us not in free space. It would suffice to say here that obtaining proper sound power levels (PWL) and then applying these are complicated to say the least.

A method of determining sound power that is used by the compressed air, and the fan and blower industry is essentially a comparison method but it is very effective in giving reproducible test results. This method requires the running of tests, usually in octave bands, of two sources. One being the source in question, the other being a calibrated reference sound source. The reference sound source (RSS) is a source with approximately the same sound spectrum as the source in question, but whose PWL has been determined from free field tests. The procedure goes like this:

  • A test is run on the RSS at some specified distance.
  • The RSS is replaced with the sound source in question and another test is run with the microphone setting in the same place as the first test.
  • Since the PWL of the RSS is known we can obtain the correction for distance, directivity factor, absorption, etc. by subtracting the SPL of the test on the RSS from the known PWL. PWL - SPL (of the RSS) = correction
  • This correction is then added to the SPL of the source in question, which gives you the PWL of the source in free field conditions.

So far, we have been discussing sound from a purely physical view. What about our second definition of sound. That of sound being the sensation our ears translate as such. Three different filters, called A, B, and C scales, are used to distinguish from sound pressure levels. For example, a measurement of 80 dB on the A scale is reported as a sound level of 80 dB(A). It is well to note here that the A scale was designed to correspond roughly to what our ears respond to in the range of 0 dB to 65 dB over-all. The B scale corresponds to the response in the range of 65 to 85 dB. The C scale, which is roughly linear, from 63 to 8000 Hz, corresponds fairly well to the ears response above 85 dB.


To be continued. Please press the next button....


2) International Applicable Standards of Noise

The noise phenomenon is not easy to understand. According to physics it is the vibration of air at frequency which can be heard by humans. The vibration corresponds with very small air pressure variations. Because the pressure variations cause noise which dissipates energy, the noise will only persist if there is a source which continuously generates the pressure variations. The noise source is analogous to a light bulb shining only while it is switched on. While the intensity of a sound power generator cannot be measured directly, the pressure variations are easy to measure at a specific location, using a microphone. These are so called sound pressure level (SPL) readings. The most common way to determine the intensity or sound power level (PWL) of the source is by calculation from several sound pressure level measurements in the environment of the source.

Although it is difficult to determine the sound power level of a noise source, it is a more useful value to know than the pressure level at a certain location. This is because the pressure level can be predicted for every location only if the power level is known.

The common way to express sound pressure levels is in dimensionless logarithmic relative ratios, or decibels. Rating the sound power level of a source is done on the same way. One of the advantages of the use of decibels is that it is possible to define the relationship between sound power and sound pressure levels very simply. Most of the national and international measuring standards have been defined within this scope.

One international standard is known as ISO 3744. In the US there are several ANSI and AMCA standards. All of these standards describes a so called control area around a "black box" which represents the noise source. In this control area a certain number of readings have to be taken. Based on the calculation of the average sound pressure level from the measurements, the standards describe rather simple methods to calculate the sound power level.

The one general noise specification designed to protect "inplant" workers is the Occupational Safety and Health Act of 1970, paragraph 1910.95. This criterion is based on sound pressure levels in dB(A) and lists nine discreet pairs of sound levels and associated permissible hours of duration. The sound levels range from 90 dB(A) for 8 hours exposure to only 15 minutes allowable exposure to 115 dB(A).

Much more difficult criteria have been established in Europe and some states, notably California, which limits the total noise at the plant boundary. In these cases the sound energy, or sound power level of the total fan installation must be studied. One of the most important factors in evaluating noise is obtaining a precise definition of the point or locus of points at which the noise specifications must be met. It is not sufficient to state: "sound-pressure levels must not exceed 90 dB(A)" without stating where measurements will be taken.

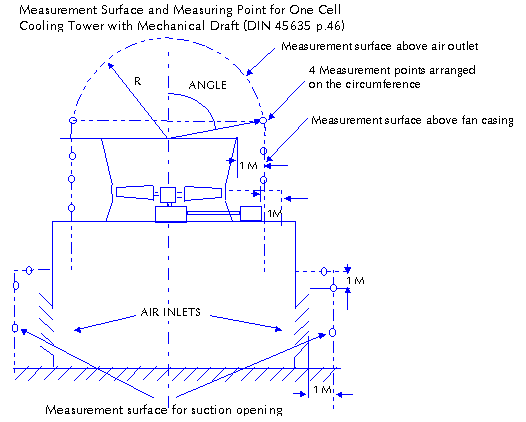
The determination of the sound performance of cooling fans is most often achieved by using this method. The one complicating factor which continuously arises is that a fan is not a "black box" like a drilling machine or a motor. If measurements are taken in the inlet or outlet air flow of the fan they can be disturbed by the so called flow noise. To prevent measuring interface from the air flow, the measurements for a cooling fan have to be taken at a distance of at least one fan diameter from the air inlet and outlet of the cooling tower.

It is interesting to note that the current CTI Code for Measurement of Sound From Water-Cooling Towers limits itself to the sound pressure measurement at a location which is agreed upon between the client and supplier. Although this method had the advantage of being very simple, it hardly contributes to a more fundamental understanding of the noise problem. Now, CTI is editing the current code as suggested by DIN standard 45.635, part 46.

3) Sources of Noise in Cooling Towers

The mechanical draft cooling towers are a source of plant noise. Two principal sources of mechanical draft tower noise are the fan and splashing water. The splashing water noise contributes primarily in the mid - to high frequency range, and the fan noise contributes primarily in the low - to mid frequency range. Therefore it is important to design each unit to produce the minimum amount of noise while still meeting the thermal requirements at a reasonable cost.

Noise in a cooling tower is generated by the mechanical equipment; fan, motor, gear reducer. Another source of noise in wet cooling tower is a water falling (hitting) noise, which is generated in hitting the water surface in the basin. Also the noise generated by the water circulating pumps can not be overlooked when they are installed outdoor at one end of the cold water basin.

The water noise of major five noise sources in an induced draft cooling tower will prevail in near field conditions, which is located within a distance of less than 4 to 5 times the air inlet height in a counter flow configuration or 1 times the air inlet height in a crossflow configuration. Beyond that distance, the noise produced by the mechanical equipment, mainly by the fan, will progressively become predominant.

4) Fan Noise

In the cooling tower, the fan is the sound power generator. The sound production of a fan in operation consists of air borne sound and contact sound. Since contact sound is related to tower layout and orientation, etc., Hudson exclusively deal with air borne sound only under the Hudson's test conditions. Therefore actual environmental conditions do not consider in sound power level calculated onto the fan rating data sheet. The sound produced by fans consists of:

  • Wideband noise caused by vortex motion and turbulence in the flow.
  • Pure tones plus harmonic due to periodically alternating forces caused by the Interaction of stationary parts and the moving blades.

Just measuring the noise of a fan does not provide enough criteria to accurately predict its noise performance. We must also know about the influence of operating conditions and dimensions on noise performance. Moreover, if noise production must be reduced, an even more sophisticated understanding of the noise generating mechanisms is necessary.

For a relatively slow running fan, there are a few characteristic noise generating flow phenomena. The so called "rotor self noise", which is the turbulent and laminar vortex shedding at the blade rear sections and at the blade tip. The ingestion of turbulence in the main air flow. This turbulence is generated by the fan supports or other upstream obstructions. It leads to random variations in angles of incidence at blade leading edges, causing fluctuating blade loads and surface pressures over a broad range of frequencies. Besides the broad band noise levels, sometimes there are discrete peaks of sound pressure associated with the blade passing frequency. This frequency is the product of the fan rotation frequency and number of blades. This noise is caused by the pressure pulsation which is generated when a fan blade passes a sharp and close disturbance such as a support beam. For a more simple point of view, it can be stated that the noise intensity of a cooling fan is related to the quantity and intensity of flow generated swirls. Theoretically, all flow mechanism as well as noise levels are controlled by the three continuity laws of fluid dynamics; the continuity of mass, impulse and energy. However, since these complex equations cannot be solved for the flow situation in a cooling tower, a more practical approach is required. Unfortunately, in contrast with the measuring standards, there is no internationally accepted method of performing an analysis on cooling fan noise. There is no real agreement between engineering societies on even the basic parameters for calculating the expected fan noise for a particular set of conditions. Some say noise is a function of tip speed, static pressure, horsepower, flow, diameter, or number of blades. Each maker has his own method. The parameters we at Hudson feel most important are tip speed and pressure differential across the fan. Hudson's position is given in a paper by K.V. Shipes.

It is actually difficult to calculate and guarantee the maximum noise level from a fan in a new installation without having tested a previous installation. Thousands of man-hours have been invested in the study of fan noise in air-cooled heat exchangers. These noise levels can be guaranteed on full-scale tests. Field tests of standard cooling tower modules must not be made to allow guaranteeing of cooling tower fan noise. The effect of water noise further complicates the problem.

When it is necessary for tower/suppliers to furnish noise guarantees to customers, it can be done if the fan manufacturer is given sufficient data concerning the fan environment. If the measurement is to be made at a point on grade level, a sketch is helpful if it shows the orientation and dimensions of the tower with respect to adjacent building or unusual terrain. The height of fans above grade height of velocity- recovery stacks, and exact location of the measurement point or points is necessary.

Noise criteria should be relayed to the manufacturer exactly as stated by the specifications. Generally, OSHA requirements are not difficult to meet if the concern is primarily fan-deck noise. If a guaranteed noise level in a community several miles away is required, the noise analysis becomes very complicated because prevailing background noise and attenuation of noise by the natural surroundings must be considered.

Fan manufacturers must exempt motor noise, gear reducer noise, and water noise from any guarantee. They can be included for special cases if sufficient data are given. Hudson is studying the attenuation of sound-absorbing covers for the high-frequency motor and gear reducer to help simplify this problem. If any type of silencers are being considered for the fans, check the economic. Most of Hudson's particular fan noise is in the 125-500 hz bands. It may be cheaper to slow the fan down, add more blades, and avoid the silencer treatment. Each case must, of course, be considered individually.

It is possible to decrease fan noise about 10 dB by reducing tip speed from 12,000 fpm to 8,000 fpm. This reduction, however, would be possible only if the fan being considered had the capability of handling 125% more pressure and 50% more flow without stalling.


To be continued. Please press the next button....


5) Sound Power Level

For the quantification of the noise intensity, and in order to compare one cooling fan configuration with another, it is at least necessary to have a relationship between the noise intensity and important design parameters like pressure drop, flow, fan speed, and fan diameter. Through years of research and field measurements Hudson has developed the following relationship;

Sound Power Level (PWL) = C + 30 Log(Tip Speed/1000) + 10 Log(hp) - 5 Log (Dia.) + f

The characteristic value C represents the influence of the fan shape on the noise generating phenomena or as practically said before, the intensity and quantity of swirls. From formula above it becomes clear that especially the tip speed has a strong influence factor on the sound power level. The correction term f is related to characteristic noise mechanisms which have been referred to already; the influence of obstructions like fan supports, the influence of the flow inlet shape, pitch angle, and tip clearance, etc. The influence of obstructions both on inlet and outlet is defined as a function of the swept area of the obstruction and the area of the fan section.

6) PWL per Octave Bands

The sound spectrum (linear) can be obtained by adding the correction factors stated below to PWL dB(A). The correction is independent of blade passing frequency.

Octave Bands (Hz)

Correction Factor

31.5 (22.3 to 44.6)

+ 2.0

63 (44.6 to 88.5)

+ 5.2

125 (88.5 to 177)

+ 4.0

250 (177 to 354)

+ 0.9

500 (354 to 707)

- 4.5

1000 (707 to 1414)

- 4.9

2000 (1414 to 2830)

- 10.1

4000 (2830 to 5650)

- 12.6

8000 (5650 to 11300)

- 19.9

In case of PWL = 104.8 dB(A), the PWL per octave bands are as follows:

Octave Bands

31.5

63

125

250

500

1K

2K

4K

8K

PWL (dBA)

106.8

110.0

108.8

105.7

100.3

99.9

94.7

92.2

84.9

7) Sound Pressure Level (SPL)

Acceptable noise levels are generally specified as a sound pressure level expressed in decibels (linear) or A-rated decibels (dB(A)), that may not be exceeded when measured at a certain distance from the noise generating equipment. The specified distance may be by the plant boundary or a given noise sensitive location, such as a residential area.

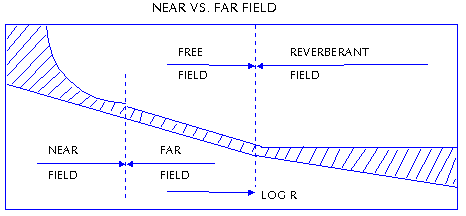
This SPL is a noise at a point from the sound source. It is the sound we measure, while the sound power level can not be measured directly. Measurements for community noise requirements are made at the plant boundary or nearest residence in the far field of the cooling tower. The far field is defined as the region where there is a linear relationship between the sound pressure level measured and the distance from the noise source.

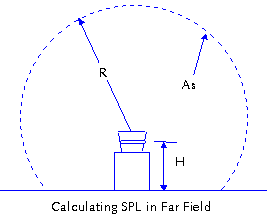
In the far field, the sound pressure level will drop 6 dB with each doubling of distance. The far field will generally begin at a distance of four times the largest machine dimension. For instance, if a cooling tower is 20 ft x 30 ft, then the far field will begin at 120 ft from the source. In the far field, the sound pressure level can be calculated by

SPL = PWL - 10 Log (As) + 0.23 (As in ft2 is the surface area over which noise is radiated.)

Noise will tend to radiate from a non-directional source uniformly in all directions. Sound pressure waves move spherically away from the source. The radius of this sphere is the distance to the measurement point. However, if there is a reflective surface impeding spherical radiation, then the radiation will become only partially spherical. In this case, the surface area also depends on the height of the noise source above the ground. In this case, As = 2pR(R + H). If the height goes to zero, the radiation takes on a hemispherical shape and As = 2pR2.

In plant noise requirements are generally in the near field of the noise source. In this region, sound pressure levels are difficult to predict because of the non-linear relationship between sound pressure level and distance from the source. Also, noise sources that are not directional in the far field may be directional in the near field.

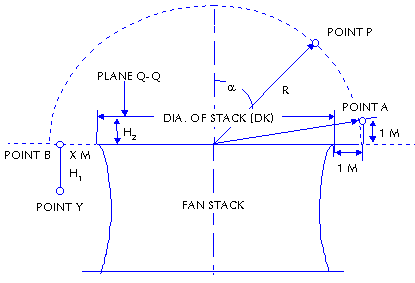
The calculation procedure specified below can be used in case there is a fan stack with a minimum height of 0.35 x fan diameter and a maximum of 1 x fan diameter.

(1) Sound Pressure Level in Point P = PWL - 2 - 10 Log 2pR2 + ( - 6.8 (1-(Cos a)0.5))
(Note that this equation could be applied to a case that the radius R is within the distance of 5 times the diameter of fan stack top and a is smaller than 90 deg.

(2) Sound Pressure Level in Point A = PWL - 2 - 10 Log 2pR2 + (2 - 6.8 (1 - (1/R)0.5))

(3) Sound Pressure Level in Point B = PWL - 2 - 10 Log 2pDK2 - 4.8 + 4 (1 - R/DK)

(4) Sound Pressure Level in Point Y = SPL in Point B - 1.5

(5) Sound Pressure Level in Plane Q - Q = PWL - 2 - Log pDK(DK/4 + H)

Let's calculate the sound pressure levels for the example of PWL of one fan is 101 dB(A) and the diameter of fan stack top is 10.119 m.

(1) SPL at Point P: R = 50 meters, a = 87.8,
then SPL = 101 - 2 - 10 Log (2 x 3.1416 x 502) + (2 - 6.8 x (1 - Cos 87.80.5) = 53.57 dB(A)

(2) SPL at Point A: R = [(10.119/2 + 1)2 + 1]0.5 = 6.14146 M
then SPL = 101 - 2 - 10 Log (2 x 3.1416 x 6.141462) + (2 - 6.8 x (1 - (1/6.14146)0.5) = 73.20 dB(A)

(3) SPL at Point B: R = (10.119/2) + 1.025 = 6.08 M
then SPL = 101 - 2 - 10 Log (2 x 3.1416 x 10.1192) + (2 - 6.8) + 4 x (1 - 6.08/10.119) = 67.71 dB(A)

(4) SPL at Point Y: R = 6.08 M, H1 = 0.5 M
then SPL = SPL at Point B - 1.5 = 66.21 dB(A)

(5) SPL at Plane Q - Q: H2 = 1 M
then SPL = 101 - 2 - 10 Log [3.1416 x 10.119 x (10.119/4 + 1)] = 78.50 dB(A)

(6) SPL at Point of Residence: This is required to analysis the noise specially.

8) Noise Calculation from Two or More Noise Sources

From two or more difference noise levels, the total sound pressure level can be calculated per the formula of 10 Log (10 0.1 x SPL1 + 10 0.1 x SPL2 ... + 10 0.2 x SPLn-1 + 10 0.1 x SPLn). This is very useful to obtain the resultant of different SPL at a point. For example, if the background noise level at a point is 53 dB(A) and the noise level due to a mechanical equipment is 59 dB(A), the total noise level at a given point is obtained from 10 x Log (10 0.1 x 53 + 10 0.1 x 59) and the result is 59.97 dB(A).

Also, the noise subtraction from a noise level can be obtained from a formula of 10 Log (10 0.1 x SPL1 - 10 0.1 x SPL2). This is frequently used to guess a noise due to mechanical equipment from a measurement of noise at a point. For example, when the noise level at a point is 55 dB(A) and the background noise at that point is 53 dB(A), let's calculate a noise level due to the mechanical equipment.

SPL = 10 x Log (10 0.1 x 5.5 - 10 0.1 x 5.3) = 50.67 dB(A).

9) Reduction of Fan Noise

Design is the primary factor affecting the fan noise. The blade design determines the pressure capability of the blade. Since the pressure is proportional to the fan speed squared, added pressure capability means a fan can run slower and do the same work. From above equation representing the sound power level from a fan, it is clear that an approach for achieving the noise reduction is to look as decreasing the characteristic value C and/or the tip speed of fan without reducing the pressure drop, flow, or fan efficiency.

Reduction of the tip speed of a fan will indeed reduce the noise generated, however it will also reduce the pressure and flow. The reduction of pressure and flow can be avoided by making the blades wider. Wider blades perform aerodynamically the same as narrow ones, but at lower speed. This is similar to a sail-plane which can fly at a lower speed than a motorized plane because of its bigger wing area. The relative width of the fan blades is expressed by the total width of the fan blades to the fan circumference in the so called solidity number.

It is evident that it is possible to make a significant improvement by making the fan blades wider. The reduction of noise generation can be almost totally yet simply explained by the possibility of reducing the tip speed, which decreases the quantity and intensity of swirls. This is attributed with a shifting to the lower frequencies, which is favorable for the A-weighted noise spectrum.

The application of low noise fans has an enormous impact on the costs of construction and performance of cooling towers. The consequences can be considered from two principle positions.

  • Avoiding of the application of sound attenuators: Sound attenuators are expensive as well as power and space consuming.
  • Higher loading and performance of an existing cooling tower: If a certain PWL value is acceptable for a particular application, then it is possible to operate the existing tower with a low noise fan with a much bigger flow than with a standard fan.